
What Is Elliott Wave Theory?
Most traders believe markets move randomly.
One day prices rise. The next day they fall. News changes, sentiment shifts, and the market seems impossible to predict.
But what if market movements are not random?
What if price action follows recurring patterns driven by human psychology?
This is the idea behind Elliott Wave Theory.
Developed by Ralph Nelson Elliott in the 1930s, Elliott Wave Theory remains one of the most widely used methods for analyzing financial markets. It is used by traders and investors across Forex, stocks, commodities, indices, and cryptocurrencies to identify trends, corrections, and potential turning points.
In this guide, you’ll learn what Elliott Wave Theory is, how it works, and why many professional traders use it as the foundation of their market analysis.
What Is Elliott Wave Theory?
Elliott Wave Theory is a method of market analysis that suggests financial markets move in repetitive patterns called waves.
According to Elliott, these waves are not random. They are the result of collective investor psychology.
When market participants become optimistic, prices tend to rise. When fear takes over, prices tend to fall. Because human emotions repeat over time, price patterns also repeat.
The theory proposes that every market trend develops through a sequence of impulsive and corrective waves.
Elliott Waves can be found on any liquid financial market.
The chart below shows Gold (XAUUSD) moving through a series of impulsive and corrective waves. Notice how the market alternates between trending phases and corrections while developing a larger bullish structure.
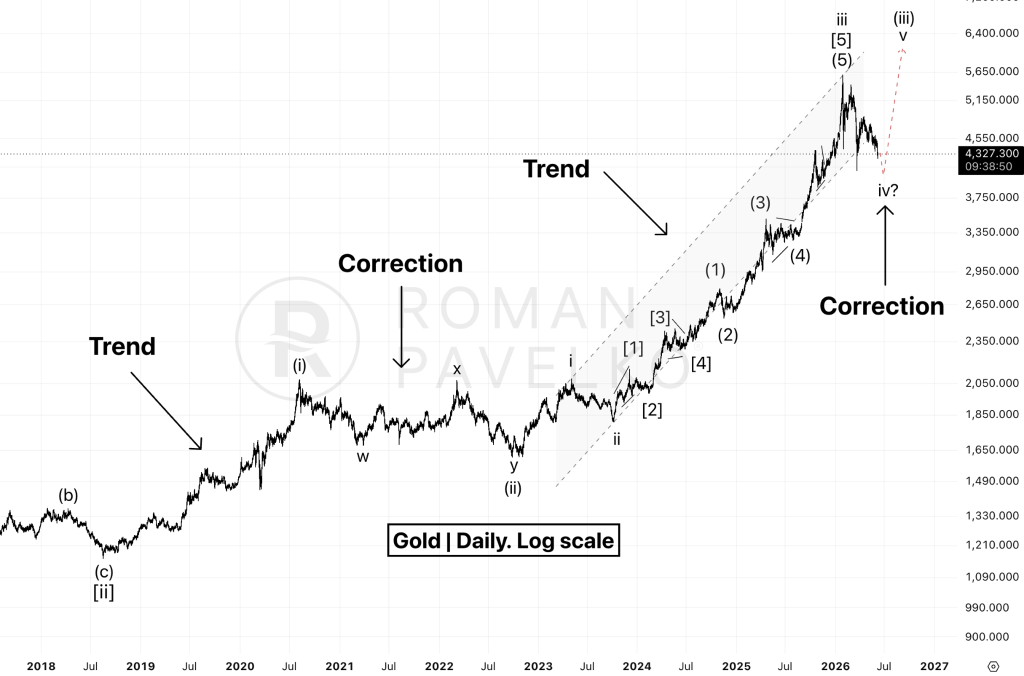
Understanding Elliott Waves becomes much easier when you see real market examples.
If you’re new to the methodology, start with my free 5-day Elliott Wave course, where I explain the core principles step by step using real charts from Forex, Gold, the S&P 500, and Crypto markets.
The Basic Structure of Elliott Waves
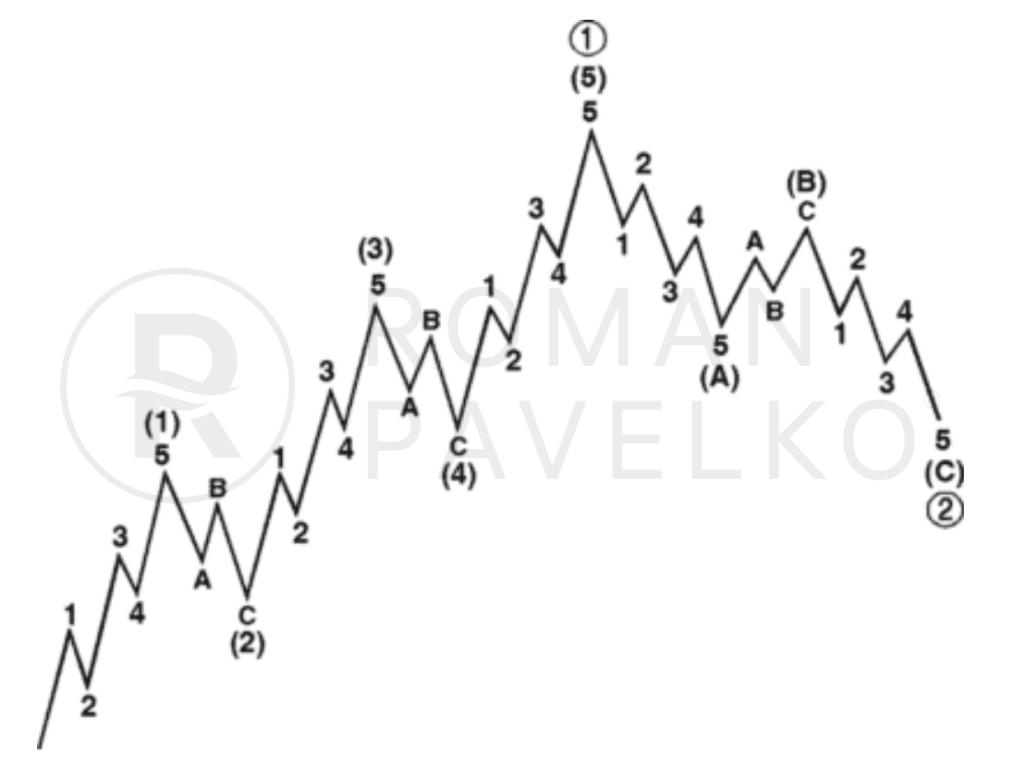
An Elliott Wave cycle consists of eight waves.
The first five waves move in the direction of the primary trend.
These are known as:
- Wave 1
- Wave 2
- Wave 3
- Wave 4
- Wave 5
After the trend completes, the market typically enters a correction consisting of:
- Wave A
- Wave B
- Wave C
The complete structure looks like this:
This sequence can occur on any timeframe.
You may find it on:
- A 5-minute chart
- A daily chart
- A weekly chart
- A monthly chart
The same principles apply regardless of market or timeframe.
Why Markets Move in Waves
The key idea behind Elliott Wave Theory is that markets reflect crowd psychology.
Investors move through cycles of:
- Optimism
- Excitement
- Euphoria
- Fear
- Panic
These emotional cycles create recognizable price patterns.
For example:
Wave 1 often begins when only a small group of participants notices a change in market conditions.
Wave 3 develops when the majority of traders recognize the trend.
Wave 5 is frequently driven by widespread enthusiasm and media attention.
The correction that follows occurs as profits are taken and sentiment shifts.
Because human behavior remains remarkably consistent, similar patterns continue to appear decade after decade.
Impulse Waves
Impulse waves move in the direction of the dominant trend and form the foundation of Elliott Wave analysis.
A complete impulse consists of five waves labeled 1, 2, 3, 4, and 5.
The chart below shows a real-world example from the S&P 500. Notice how the market advances through a sequence of five waves while periodically pausing in corrective pullbacks.
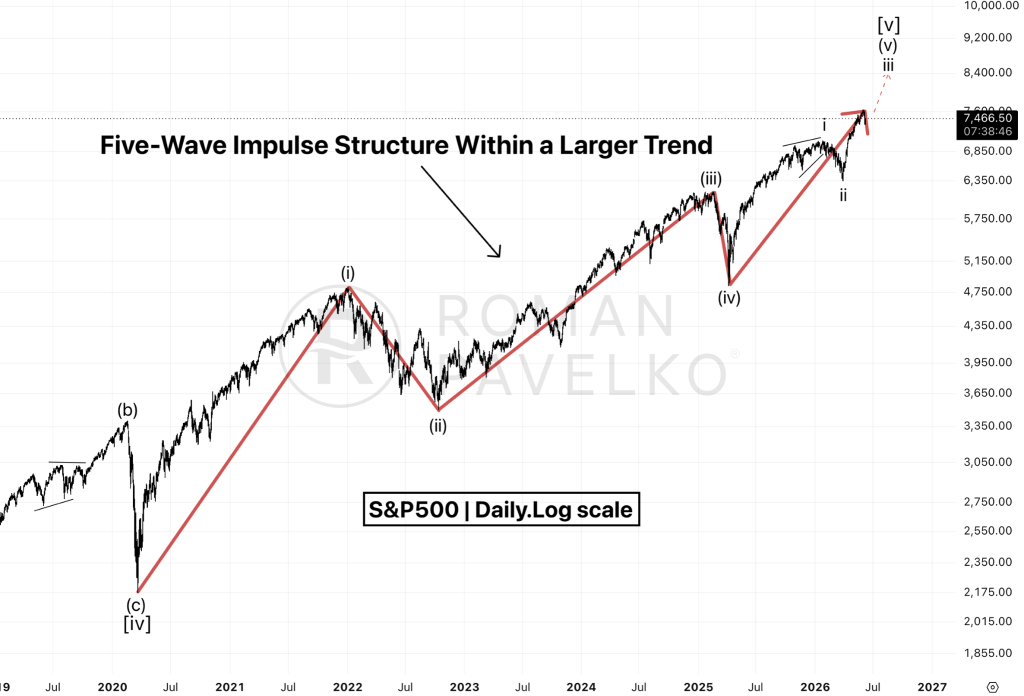
Wave 3 is typically the strongest and most dynamic part of the trend. This is often where institutional participation becomes most visible and momentum accelerates.
Wave 5 completes the structure and frequently occurs when bullish sentiment is strongest.
Corrective Waves
Not every market move is trending.
Markets spend a significant amount of time correcting previous advances or declines.
These movements are known as corrective waves.
A typical correction consists of three waves:
- Wave A
- Wave B
- Wave C
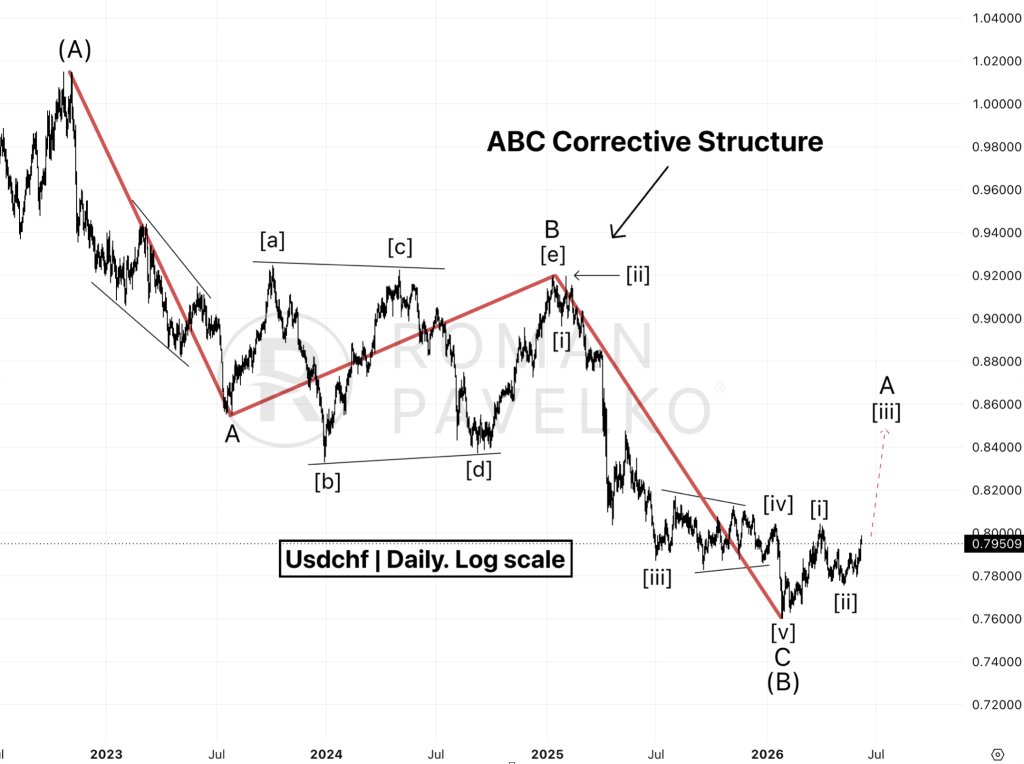
Corrections often appear more complex than impulse waves.
Some of the most common correction types include:
- Zigzags (Double, Triple)
- Flats
- Triangles
- Combinations.
If you want to learn these structures in detail, read our complete guide to Elliott Wave Patterns
The Fractal Nature of Elliott Waves
One of the most fascinating aspects of Elliott Wave Theory is its fractal structure.
Each wave contains smaller waves.
For example:
A Wave 3 on a daily chart may itself consist of a complete five-wave structure on a 4-hour chart.
Likewise, each of those smaller waves can be divided into even smaller waves.
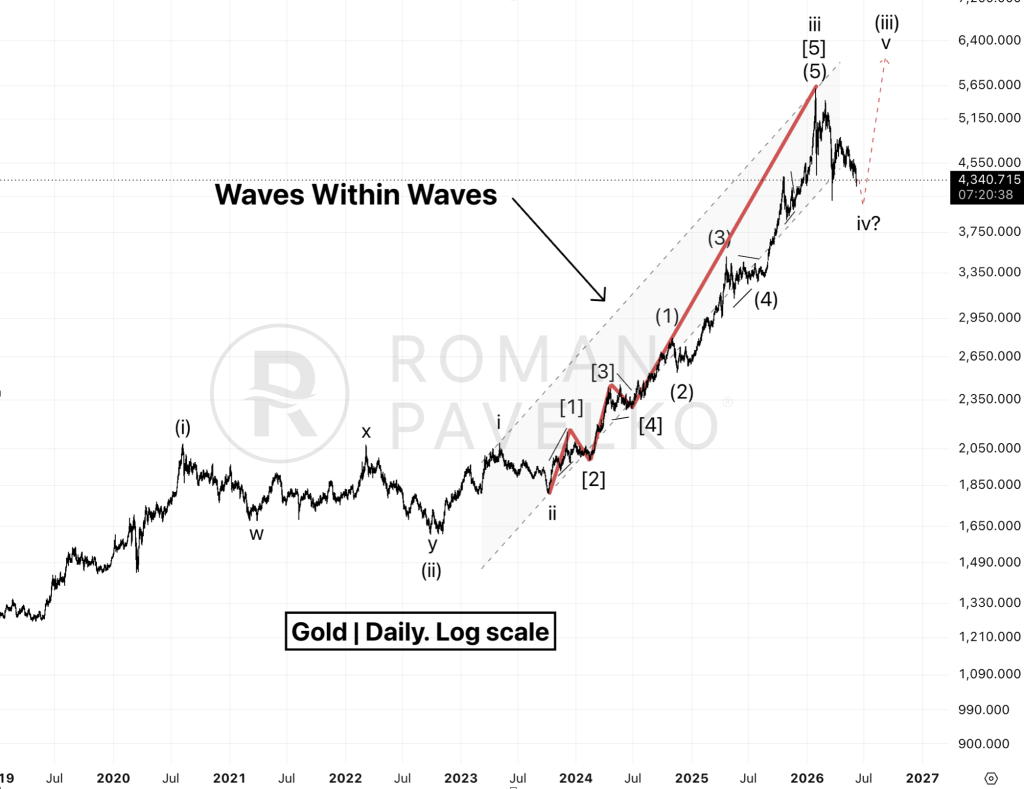
This concept allows traders to analyze markets across multiple timeframes while maintaining a consistent framework.
Elliott Waves and Fibonacci Ratios
Elliott Wave Theory is closely connected to Fibonacci mathematics.
Many waves tend to develop according to Fibonacci relationships.
Common examples include:
- Wave 2 retracing 50% or 61.8% of Wave 1
- Wave 3 extending 161.8% of Wave 1
- Wave 4 retracing 23.6% or 38.2% of Wave 3
- Wave 5 projecting from earlier waves
These relationships help traders identify potential targets and areas of support or resistance.
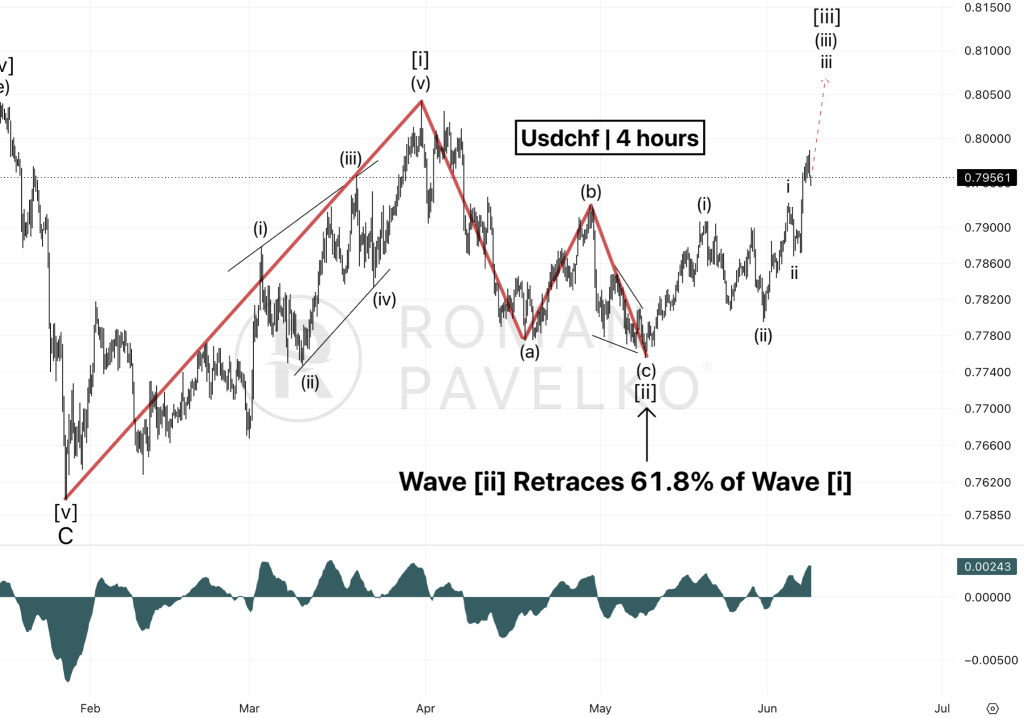
Figure 6. Fibonacci retracement levels help identify potential reversal zones within Elliott Wave structures. In this example, Wave [ii] retraces approximately 61.8% of Wave [i] before the larger trend resumes.
Advantages of Elliott Wave Analysis
Why do traders continue to use Elliott Wave Theory nearly a century after its creation?
Several reasons stand out.
- Market Structure
The theory provides a framework for understanding market behavior.
- Forward-Looking Analysis
Unlike many indicators, Elliott Waves focus on future possibilities rather than past data.
- Multi-Timeframe Application
The method works across Forex, stocks, commodities, indices, and cryptocurrencies.
- Risk Management
Wave invalidation levels provide clear points where a market view is proven wrong.
Common Misconceptions
Many traders dismiss Elliott Waves because they believe the theory is subjective.
While wave analysis requires experience, the same is true of many professional disciplines.
The most successful Elliott Wave analysts rely on:
- Strict rules
- Probability
- Risk management
- Multiple scenario planning
The goal is not to predict every market move perfectly.
The goal is to identify high-probability market structures and manage risk effectively.
Can Elliott Waves Predict the Market?
No analytical method predicts the future with 100% accuracy.
Elliott Wave Theory is not a crystal ball.
Instead, it provides a framework for understanding where the market is most likely within its larger cycle.
Professional traders use wave analysis to create scenarios, identify opportunities, and manage risk.
The objective is not certainty.
The objective is probability.
Final Thoughts
Elliott Wave Theory offers a unique way to understand financial markets.
Rather than viewing price movements as random, it interprets them as recurring patterns driven by collective human behavior.
By understanding impulse waves, corrective waves, and market structure, traders can develop a clearer view of trends and potential turning points.
Whether you trade Forex, stocks, commodities, or cryptocurrencies, Elliott Wave analysis provides a framework that can help you make more informed decisions.
Start Learning Elliott Waves Today
Join the free 5-day course and learn how professional traders read market structure.
Start Free CourseFree access · Real market examples · Daily lessons